Are you curious about Montana’s economy and how it measures up in terms of GDP per capita? Well, you’ve come to the right place. In this article, I’m going to delve into the topic and give you all the details.
You’re sitting in the serene beauty of Montana, surrounded by breathtaking landscapes and wide open spaces. But have you ever wondered about the economic vitality of this picturesque state?
How does it stack up against other states in terms of wealth and income? You may have heard terms like personal income and unemployment rate thrown around, but what do they really mean?
We’ll explore Montana’s economy and uncover the factors that contribute to its overall prosperity from the lowest unemployment rate to the dynamic Business Services industry.
Whether you’re an employee, an employer, or simply curious about Montana’s economic journey, this article is for you.
- Related article: Montana’s Economic Highlights
So buckle up and get ready to dive into the fascinating world of Montana’s GDP per capita. Trust me, you won’t want to miss it!
GDP per Capita Definition
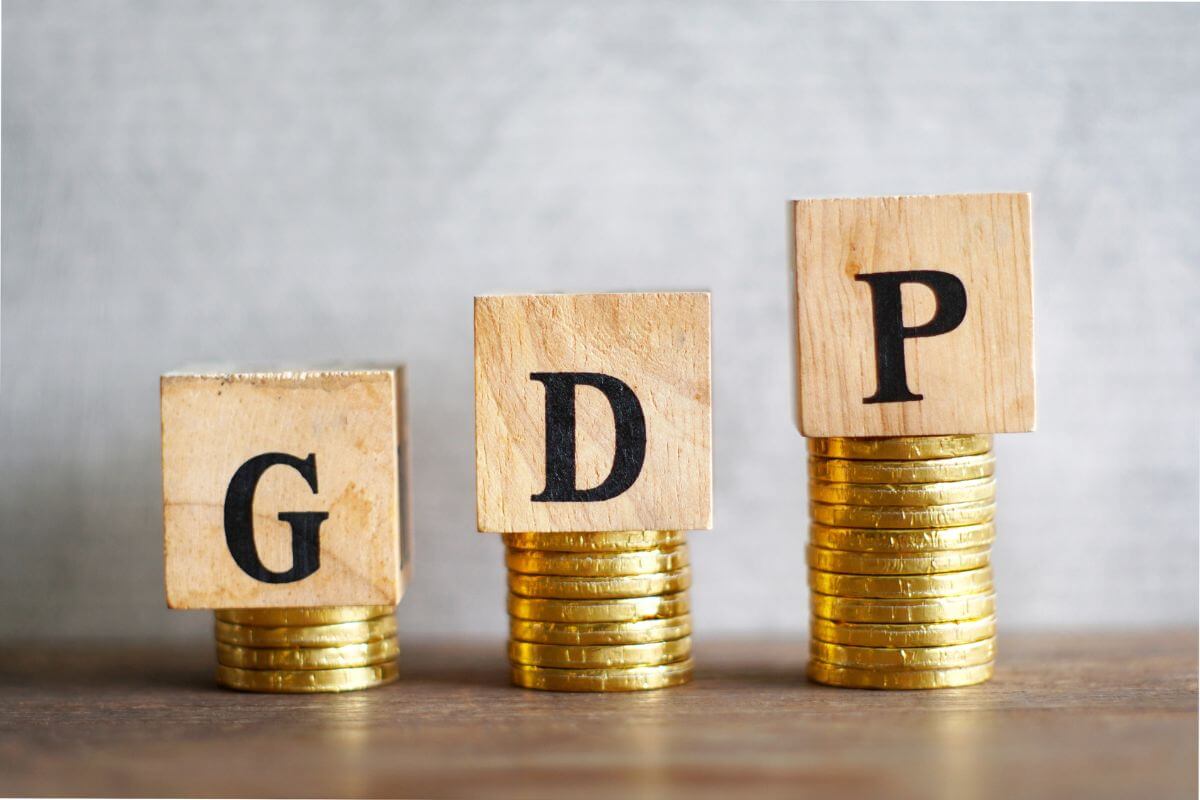
Have you ever wondered how economists measure the economic vitality and wealth of a country or state? Two commonly used metrics are Gross Domestic Product (GDP) and Gross State Product (GSP).
GDP is essentially a measure of the total market value of goods and services produced in a country in a certain amount of time. It gives us a snapshot of a nation’s productive capacity and overall wealth.
Similarly, GSP is the measure of economic output for individual states in the United States. It is a measure of a country’s or state’s productive capacity or wealth.
Countries or states with equal GDP or GSP can have vastly different populations. This is where GDP per capita comes into play.
It’s like a magnifying glass that helps us understand the resources available to a particular country or state relative to its population.
To calculate GDP per capita, we simply divide the total GDP by the number of people living in that country or state. Another way to measure economic output is through Gross Domestic Income (GDI).
Unlike GDP, which focuses on the value of goods and services, GDI includes all the income earned within a country, including wages, profits, and taxes. It provides a different view of a country’s performance.
So, why is GDP per capita important? Well, it provides a more accurate picture of a state’s economic output per person rather than just relying on the overall GDP or GSP.
Measuring GDP per capita helps assess people’s economic well-being in a state. High GDP per capita often means more resources for areas like education.
Montana Economic Characteristics

When it comes to economic characteristics, one key indicator is Montana’s GDP per capita, which offers a glimpse into the economic well-being of its residents.
By understanding this measure, we can gain insight into the resources available, the average economic output per person, and the overall prosperity of Montana.
Montana GDP per Capita

Per capita real Gross Domestic Product (GDP) is a fundamental economic gauge that measures the economic output per person in a given region.
It provides valuable insights into the standard of living and economic growth of a state or country. For Montana, the per capita real GDP has shown steady growth over the years.
Table of Per capita real Gross Domestic Product of Montana from 2009 to 2019:
| Year | Montana Per capita real GDP (in chained 2012 U.S. dollars) |
|---|---|
| 2019 | $44,145 |
| 2018 | $43,576 |
| 2017 | $42,784 |
| 2016 | $42,528 |
| 2015 | $43,544 |
| 2014 | $42,250 |
| 2013 | $41,866 |
| 2012 | $41,847 |
| 2011 | $41,585 |
| 2010 | $40,925 |
| 2009 | $39,978 |
It is important to note that “in chained 2012 U.S. dollars” refers to a method of adjusting economic values to account for changes in price levels over time.
This adjustment helps to make comparisons between different years more accurate by removing the effects of inflation or deflation.
Montana’s per capita real GDP growth from 2010 to 2019 had an average annual growth rate of 0.85%. This indicates a gradual increase in the state’s economic output per person over the years.
Furthermore, Montana ranks 8th in terms of GDP growth among states over the last 5 and 10 years, up until 2013.
With consistently faster growth than the U.S. average since 2000, except for 2012, Montana’s economy has shown resilience and potential.
In 2018, Montana’s GDP per capita was $43,509, which was lower than the national average of $62,823.31.
Montana’s total GDP in 2021, in current dollars, was $59.3 billion, while the national average stood at $23.32 trillion USD.
In 2022, Montana’s GDP reached approximately $65 billion, with the finance, insurance, real estate, rental, and leasing sectors contributing the largest tangible value to the state’s GDP.
The most recent update on Montana’s GDP from the U.S. Bureau of Economic Analysis for the first quarter of 2023 is $67.78 billion, indicating ongoing growth in the state’s economy.
Montana Average Population and Median Household Incomes

The state has a population estimate of 1,122,867 residents as of July 2022, showing a varied mix of individuals and families contributing to the economy.
In Montana, the median household income is $60,560, signifying the middle point where half of the households earn more and half earn less, giving an average annual income glimpse for Montana families.
Montana’s per capita income is $34,423, indicating the average earnings per person in the state, covering wages, salaries, and investments offering a glimpse into the financial status of the average Montanan.
In terms of growth, Montana’s wage growth ranks 5th among states in both the 5 and 10-year timeframes, indicating a positive trend in the state’s income levels, with workers seeing an increase in their earnings.
When looking at specific locations within Montana, the highest mean income, or family income, can be found in Whitefish, Flathead County, with an average of $111,754.
Following closely behind are Bozeman, Gallatin County, with an average income of $95,595, and Belgrade, also in Gallatin County, with an average income of $93,990.
In January of 2023, according to the United States Federal Reserve, the total personal income in Montana was $67.43 million. These figures highlight the pockets of prosperity within the state.
Montana’s income levels indicate a diverse range of economic opportunities and a mixture of income brackets. The state has consistently outperformed the national economy since 2000.
However, it is important to note that economic performance varies across different regions of Montana, with some areas experiencing rapid growth and others facing more significant challenges.
The eastern region of Montana, particularly influenced by the Bakken oil fields, has seen rapid economic growth with significant job expansion and rising wages.
- Learn more about Oil Exploration in Montana
In contrast, the Northwest and Southwest regions experienced substantial contraction during the national recession due to their reliance on construction and wood product manufacturing employment.
The Southwest region recovered quickly, while the Northwest faced an extended recession and continues to have elevated unemployment annual rates.
Montana Domestic Product Contribution to the U.S.
While Montana might not share the same size or population as other states, its impact on the U.S. economy is significant.
Through its varied economic sectors, Montana’s GDP not only benefits its own residents but also bolsters the national economy.
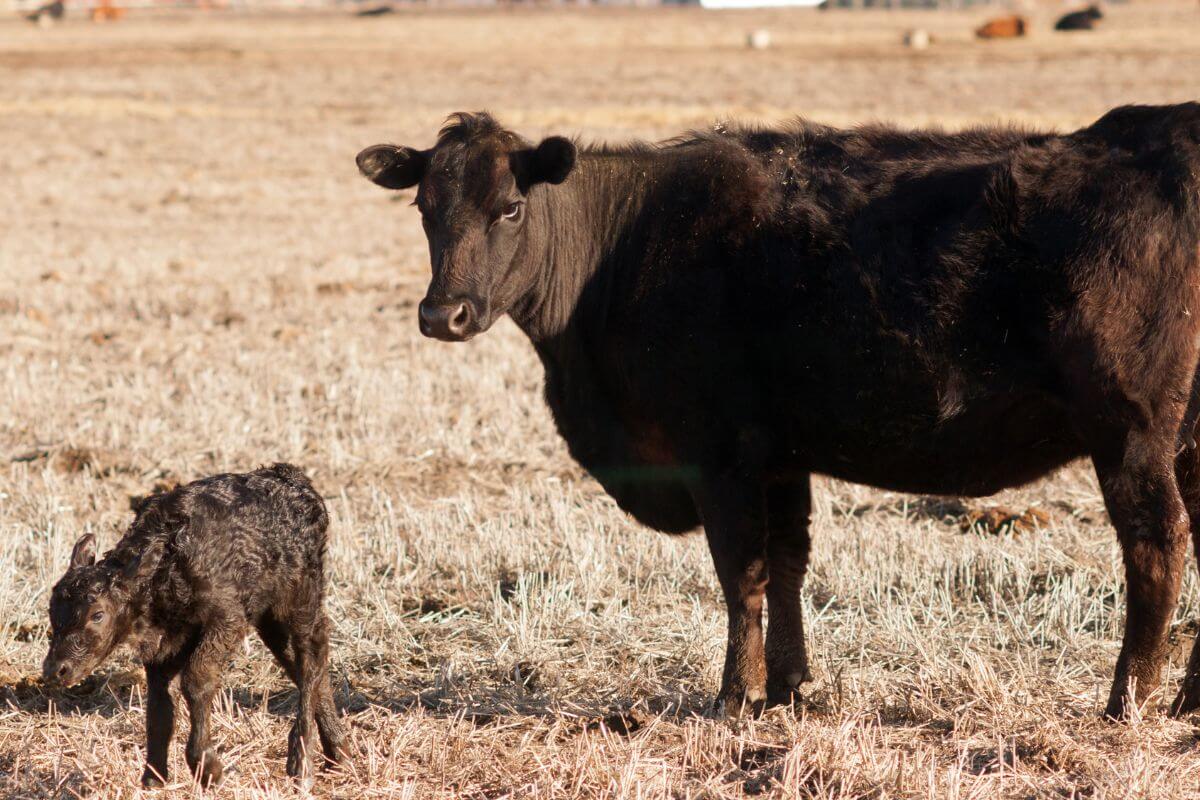
In 2021, the industry of agriculture in Montana generated a substantial sum of approximately $4.2 billion in cash receipts, with the highest-valued commodities being cattle and calves, wheat, and hay.
That same year, the value of Montana’s agricultural production and processing industries represented 4.1% of total state GDP.
And that’s not all. Montana’s natural resources, including minerals, timber, and coal, further enhance its economic prowess, bringing value and stability to the nation.
Montana also has a vibrant tourism industry that bewitches visitors from all corners of the globe.
With its mesmerizing national parks, untamed wilderness areas, and an array of recreational opportunities, tourists flock to Montana like bees to honey.
From exciting hunting and fishing to calming hikes and exhilarating ski runs, Montana’s outdoor pursuits charm and bring in significant revenue, invigorating our economy.
Among its many notable industries, agriculture, natural resources, and tourism reign supreme as the largest contributors to Montana’s economic tapestry.
Montana Unemployment Rate

On August 21, 2023, Governor Greg Gianforte revealed a remarkable statistic, the unemployment rate in July was below 3% for the 21st consecutive month.
According to the U.S. Bureau of Labor Statistics, the last time this remarkable state had an unemployment rate below 3% was just three short months back in 2007.
Gov. Gianforte also announced Montana’s total employment reached an all-time high, with nearly 563,000 Montanans working in July.
Since the 2001 recession, Montana has maintained an unemployment rate below the national average, staying 1.5 percentage points lower than the overall U.S. rate until 2014.
While Montana reached an extraordinary low of 2.4% unemployment rate in February, the rest of the nation saw a rise to 3.6%.
It’s almost as if Montana decided to dance to its own rhythm, defying norms and charting its unique course to economic glory.
Montana Industry Trends

In 2022, the largest contributors to Montana’s employment were Healthcare and Social Assistance, Retail Trade, and Accommodation and Food Services.
Together, they accounted for a staggering 44.6% of the state’s workforce. These industries have been flourishing, showcasing their resilience and steadfast growth even during challenging times.
The table provides employment figures and growth percentages for various industry departments:
| Sector | Employment | Growth 2022 (%) | Annualized Growth 2017-22 |
|---|---|---|---|
| Healthcare and Social Assistance | 81,790 | 2.1% | 1.4% |
| Retail Trade | 71,086 | 2.2% | 0.6% |
| Accommodation and Food Services | 48,405 | 8.6% | 0.6% |
| Construction | 38,827 | 0.6% | 3.8% |
| Information | 32,408 | 2.9% | 1.7% |
| Professional, Scientific and Technical Services | 27,755 | 1.8% | 1.0% |
| Educational Services | 26,633 | 2.3% | 2.2% |
| Administration, Business Support, and Waste Management Services | 24,842 | 4.5% | 4.6% |
| Other Services (except Public Administration) | 21,688 | 2.2% | 1.6% |
| Transportation Industry and Warehousing | 20,864 | 4.2% | 4.2% |
| Wholesale Trade | 17,136 | 3.6% | 0.8% |
| Real Estate and Rental and Leasing | 14,389 | 1.6% | 2.6% |
| Arts, Entertainment and Recreation | 14,192 | 4.2% | 1.3% |
| Mining | 4,731 | 4.9% | 1.8% |
| Utilities | 3,948 | 0.6% | -0.9% |
| Agriculture, Forestry, Fishing and Hunting | 2,504 | 3.8% | 2.1% |
By analyzing the employment trends in different sectors, we can gain valuable insights into which parts of the economy are experiencing the fastest growth or contraction.
It’s like peering through a keyhole into the pulsating heart of Montana’s economic anatomy.
With this intriguing snapshot of industry trends, one thing becomes abundantly clear: Montana is a state brimming with diverse opportunities and a resilient economy.
Montana GDP per Capita Final Thoughts

Montana’s GDP per capita provides a vital clue to understanding the state’s economic outlook and its potential for growth.
We can anticipate continued growth in major sectors like Healthcare and Social Assistance, Retail Trade, and Accommodation and Food Services as their performance indicates a promising future.
Additionally, we must keep a close eye on industries like Construction, Information Services, and Professional, Scientific, and Technical Services, as they quietly contribute to the state’s progress.
As Montana’s economy evolves, we must also consider the contributions from the government and different industries.
The economies of counties like Missoula County, as well as the influence of the Federal government, play a significant role in shaping the state’s economic landscape.
Dollars by industry and the millions of people employed in various sectors are all interconnected, creating a complex web of economic activity.
Montana’s GDP per capita provides a glimpse into the economic health of the state, reflecting not only the performance of its industries but also the potential for growth.
As we continue to explore this captivating destination, let us embrace the intertwining threads of employment, innovation, and economic vitality that make Montana a truly remarkable place.
Montana GDP per Capita FAQs
1. What Is the GDP per Capita of Montana?
In 2022, the real gross domestic product (GDP) of Montana was 49.75 billion U.S. dollars. This is a slight increase from the previous year when the state’s GDP amounted to around 48.98 billion U.S. dollars.
2. Which State Holds the Highest GDP?
California stands as the largest state economy in the U.S., boasting a real GDP of $2.9 trillion.
When considering its nominal value of $3.6 trillion and comparing it to global national GDPs, California’s GDP would secure the 5th position, trailing closely behind Germany and Japan. This information is as of July 19, 2023.
3. Which State Is Considered the Poorest in Terms of GDP?
In terms of GDP, Vermont is considered the poorest state in the United States with a GDP of $40,617 million in 2022.
Wyoming, with a GDP of $47,433 million, and Alaska, with a GDP of $63,618 million, also rank among the states with relatively lower GDP figures.
4. What Makes up Montana’s Disposable Income per Capita?
In 2022, Montana recorded a disposable personal income (DPI) of $57700, surpassing the national average of $56600, positioning it as the 5th highest among all 50 U.S. states.
Disposable personal income (DPI), is a vital economic indicator, this is the money that the average individual in an economy possesses for both spending and saving after deducting income taxes.
If you’re interested in diving deeper into Montana, stay involved with these articles:
- Montana’s Financial Situation
- Montana’s Tourism Earnings
- Montana Industry Focus
- Montana’s Production Output Focus
- Wheat Cultivation in Montana
- https://nces.ed.gov/pubs/esn/n04a.asp
- https://news.mt.gov/Governors-Office/Montanas_Economy_7th_Strongest_in_Nation_With_Robust_Growth_in_2021
- https://www.census.gov/quickfacts/fact/table/MT/PST045222
- https://mslservices.mt.gov/legislative_snapshot/Economy/Default.aspx
- https://economic-impact-of-ag.uada.edu/montana/
- https://news.mt.gov/Governors-Office/Montanas_Unemployment_Rate_Below_3Percent_For_21st_Consecutive_Month